Friday 26 December 2014
Sunday 14 December 2014
Update: Yahoo Stub
Ever since I made the Long YHOO/Short BABA & YAHOF pitch, things have been going my way.
YHOO is up 23%, BABA up 12% and YAHOF down 12%. On a net basis, this stub trade has been phenomenal, primarily because it is technically an infinite IRR trade.
I view YHOO as a BABA alternative trading at a discount. Even with the massive YHOO price appreciation, EV has only increased by $5B, from a NEGATIVE $12.5B to a NEGATIVE $7.5B. The market has accolade YHOO at a significant discount to book value because it is valuing what it believes to be value destructive actions by management. I disagree with this tenet.
I believe that MM is not as value destructive as what people believe she is. In fact, in the long run, she might actually be value accretive. It is hard to say, but at a NEGATIVE $7.5B EV, at current prices, YHOO should be worth at least $57.50 ascribing no value to YHOO core business and MM value.
Tribune Publishing
https://www.dropbox.com/s/1igrrzjxps9wxi8/Long%20Tribune%20Publishing%20%28TPUB%29.pdf?dl=0
Friday 12 December 2014
Thursday 20 November 2014


Sears: VW 2.0
Sears.
5% free float. 20% short interest.
$8.6b in real estate value. $1.4b in working capital. $3.5b in net debt.
Est. market capitalization = $6.5n = $61/share
This does not take into account of some of Sears most valuable businesses. For e,g, - Sears home service and protection business, Kenmore, Craftsman & Diehard to name a few.
I believe the value of the above additional value is more than enough to offset Sears pension liabilities and cost of winding down uneconomic stores.
In addition, you get a world class CEO. Eddie Lampert, who is an excellent capital allocator. Excellent is actually an understatement. Since 1988, Eddie Lampert hedge fund returned 29% CAGR. So you can be rest assured that you are in good hands. He WILL monetize Sears.
You can buy Sears today at $36/share, or a 70% upside to a very conservative intrinsic value. What is better is that the current short interest to free float ratio is 4 to 1. And the cost of borrow for Sears is 20%. Eventually, people will recognize the monetization efforts of Eddie Lampert and we will see a massive short squeeze. Similar to the one that occurred to VW in 2008. Probably not as bad, but it is a precedent.
The best part is that you can do this via warrants. Yesterday, Sears distributed its warrants. These are 2019 call warrants with a $28 strike price. You can buy these warrants at $17 per piece today. That translate to a 100% upside assuming no time and volatility premium. As I think that this will happen in short order (if not I will switch to a stock position), I believe that the premium, which is currently at ~$9, will actually expand. Assuming no expansion, these warrants have a 150% upside and optionality from additional value from Sears business, gamma expansion, or a massive short squeeze.
Thank you.
Wednesday 19 November 2014
Blucora: An Update
Since my last post, BCOR has dropped 12%, all while INTU, a closest comparable in the online tax segment, rose 6.7%.
When you wish for a stock price to go down so you can buy more, you know you have a great stock.
Over the LTM, BCOR Tax Preparation business had managed to achieve $50m in segment income, assuming run-rate EBITDA conversion, EBITDA is expected to be $40m, or roughly 17% higher than FY 2013.
While a crude method of valuation, using a comparable company valuation method is a good way to giving one a good ballpark estimate of the value of BCOR hidden tax prep asset.
INTU, the closest comparable, trades at 16.6x EBITDA. Using the same multiple would mean that TaxAct is worth $664 million, more than the entire EV of BCOR right now.
A fellow value investor have commented that I might have placed too high a multiple of BCOR search business and E commerce. I agree. I believe BCOR E-commerce and Search business is set to generate $70m-$80m in EBITDA collectively. Using a low 5x EBITDA on that, we get a valuation between $350m-$400m.
Tax Prep + Search + E commerce + net cash = ~$1.1B market capitalization, or roughly 100% upside from current prices.
Soilbuild Construction & TA Corporation
Interesting company.
Positive EBIT but yet negative ROIC. How is this possible? The denominator is negative.
Unlike many of its peers, Soilbuild is highly capital light, has low corporate overhead but trades at distress levels.
Soilbuild Construction
Corporate Overhead Margin: 2.7%
EBIT Margin: 7.0%
ROIC: 35.7%
EV/EBIT: 4.62x
However I would like to highlight that EBIT margin has been trending downwards, from ~11% in Q4 2012 to 7% in Q3 2014. Quite large a margin compression.
TA Corporation
Corporate Overhead Margin: 7.9%
EBIT Margin: 10.0%
ROIC: 2.6%
EV/EBIT: 11x
Net Debt/EBITDA: 6.2x
I believe TA Corporation is the closest comparable to Soilbuild construction but yet they trade at such different levels.
Similar to Soilbuild Construction, TA Corp had seen margin compression from 14.6% in Q4 2011 to 10% in Q3 2014.
As I do not have much to contribute to the future of the Singapore property market, I believe that a pair trade would be the most appropriate.
Long Soilbuild, short TA Corp.
Sunday 16 November 2014
Haw Par Corporation
Link to long write-up: https://www.dropbox.com/s/tgbzuvpw7qnvi4x/Haw%20Par.pdf?dl=0
Short write-up
At $8.50 per share, Haw Paw is an attractive long opportunity to own valuable assets at negative implied enterprise value.
Summary:
1) Owns the iconic Tiger Balm brand which has a long growth runway and is able to
consistently earn significantly above cost of capital.
2) Concerns surrounding the Singapore oceanarium are exaggerated from a macro view
and the company has levers that it can pull to stem further losses.
3) Significant equity investments in Singapore and Hong Kong which value surpasses Haw
Par EV.
4) Owns several investment properties which have ascertainable value which generates
consistent FCF.
Market Capitalization: $1.86 billion
(+) Cash: $213.4 million
(-) Debt: $43.4 million
= Enterprise Value: $1.69 billion
EV/Core EBIT: 57x
From the standpoint of a typical investor, Haw Par would fall through most screening criteria:
high EV/EBIT and a deteriorating situation in a capital intensive segment. However, a simple
reading into Haw Par’s annual report would reveal the enormous hidden asset the company
owns.
SOTP Valuation:
Tiger Balm
High ROIC, long growth runway.
FY 2013 EBIT: $25.9 million
Using a DCF methodology, believes that on highly conservative assumptions, Tiger Balm is worth $283 million, or 11x EBIT.
Using general comparable methodology, Tiger Balm is worth $413 million, or 16x EBIT.
Using a closest comparable methodology, Tiger Balm is worth between 22x to 40x EBIT, or between $570 million to $1036 million.
I will use an average between a DCF approach and a general comparable approach to get a $350 million valuation, or 13.5x EBIT. But understand that on a closest comparable approach, Tiger Balm could easily be worth 2x as much.
Underwater World
Underwater World business can be split into two distinct geographically location with very different situation: Singapore and Pattaya.
Singapore UWW business is dying but Pattaya is thriving.
The market seems to be valuing the UWW segment on a whole and failed to realize that the UWW Singapore lease is due in three years. Management could shut down operations and stem losses easily.
While a SOTP on the UWW segment is ideal, it is extremely hard to de-consolidated this business. Instead, I will use an extreme worst case DCF scenario to arrive at the fair value.
Using a worst case DCF approach, I value the UWW segment at a negative $40 million.
Equity Investments
Haw Par owns many listed equity securities such as UOB and UOL.
The value of Haw Par equity holdings is worth $2.3 billion, 50% higher than Haw Par's current market capitalization.
This is where the bulk of Haw Par's value is derived upon.
Investment Properties
Haw Par owns several real estate with a value from external valuer at ~$220 milion.
Using my own conservative assumptions, I value this to be $145 million
Sum of the Parts
Sunday 19 October 2014
Poh Tiong Choon Logistics
With the recent market decline and a possible market correction going forward, Poh Tiong Choon Logistics, short for PTCL, poses an interesting opportunity.
PTCL, as the name suggests, is a logistic company. It's main businesses involves transportation and bulk cargo and warehousing. They also own several investment properties in which they lease for rental income.
Personally, I believe that logistics is an extremely interesting business to look at, especially in Singapore. As the developing nations continues to grow (China, India, Indonesia, etc), trade activity in Singapore is bound to expand. However, given limited space in Singapore and near vessels, logistic company becomes relevant, especially those with warehousing capabilities.
In addition, the market in which PTCL targets is an interesting and niche one. Chemicals. PTCL have a warehouse in Jurong Island which have storage and drumming capabilities for chemicals which allows them to charge premiums for its services. The chemical industry is also one which seems to be undergoing a period of renaissance with the advent of hydraulic fracturing. Thus I believe that PTCL should experience additional tailwinds in this aspect.
However, the market do not seem to recognize PTCL competitive advantage and opportunity as the core PTCL (Logistics and warehousing) trades at a normalized 4.0x EV/FCFE, 4.0x EV/EBITDA.
Assuming a 2% growth rate (below expected inflation) and a 10% RRR (above PTCL ERP of 6%), the fair value for the core PTCL comes up to be $0.78 per share.
Including the value of the investment properties less a 25% haircut on value, total value of PTCL comes up to be $0.95 per share. or a 40% upside to current prices.
Below is my analysis on PTCL.
For a company which have a ~25% ROIC, 3.6% growing dividend yield and book value growth over time, PTCL is a highly attractive opportunity.
Saturday 4 October 2014
Blucora
How much would you pay for a business that should produce near mid double digit revenue growth rate at least for the coming few years which generates ~40% EBITDA margin? 10 times EBITDA? 15 times EBITDA?
Introducing Blucora.
Blucora operates in 3 areas: Search, Tax Preparation and E-Commerce.
Search
The Blucora business model is simple to understand, just think of it as a value added reseller of search engines. If a website owner, lets call him Shaun, wishes to add search functions on his homepage but do not have the expertise or technology to do so, he contact Blucora. Blucora will then contact Google or Yahoo to syndicate their search results. Blucora would then build out portals for Shaun and when someone clicks on a paid ad at his website, everyone gets a cut.
Pretty interesting.
In addition, Blucora owns several legacy search engines such as dogpile.com and webcrawler.com which believe it or not, people still use.
 Tax Preparation
Blucora also owns TaxACT. It is a wonderful business. It is a fast growing online tax preparation firm. To understand how wonderful this business is, we have to understand the industry.
The tax preparation industry is dominated by Paid Preparers and the DIY people. Paid Preparers are tax stores such as H&R Block while DIY people are people who fill taxes using paper and pen and online. The market share of each is more or less split, although Paid Preparers is probably the front runner. For now.
Within the DIY segment, more and more people are shifting to online from paper and pen, AND, Paid Preparers are losing market share to the DIY segment. Although, the Paid Preparers will probably have a strong competitive edge due to complexity, but regardless, TaxACT is at the right segment of the industry. In addition, TaxACT has a wonderful business model which creates stickiness. When you are able to create stickiness at an early part of a growth phase and is able to generate high cash margins on that stickiness, you get very interesting results.
E-Commerce
Blucora also own Monoprice, an online retailer that sells consumer electronics under its label. I dont have much of a thought on this segment but it seems to be generating significant free cash flow so that is good.
Valuation
So, currently H&R Block, a paid preparer, trades at 8.2x EBITDA and had low single digits revenue growth. On the other hand, TaxACT had near mid double digits revenue growth rate in 2013. In addition, TaxACT have a lower reinvestment requirement. So, what is the right multiple for such a business?
Well, lets just slap on a 8.2x EBITDA and see what we get. Using the 2013 values (I dont use the LTM due to effects of seasonality, but it is much more conservative anyway), Blucora Tax Preparation business is worth $285 million.
 With a 8.2x EV/EBITDA, Blucora Search and E-Commerce implied EV/EBITDA is 4.6x. Wow. 4.6x implied EV/EBITDA is distressed level. Assuming 0% growth, 4.6x EBITDA would imply a ~22% discount rate. That is quite...aggressive, and this is the Bear Case. Using a more conservative, albeit still high, discount rate of 18% and with 2% growth, the implied EV/EBITDA should at least be 6.1x. The Bear Case would then imply a 16.2% upside.

Introducing Blucora.
Blucora operates in 3 areas: Search, Tax Preparation and E-Commerce.
Search
The Blucora business model is simple to understand, just think of it as a value added reseller of search engines. If a website owner, lets call him Shaun, wishes to add search functions on his homepage but do not have the expertise or technology to do so, he contact Blucora. Blucora will then contact Google or Yahoo to syndicate their search results. Blucora would then build out portals for Shaun and when someone clicks on a paid ad at his website, everyone gets a cut.
Pretty interesting.
In addition, Blucora owns several legacy search engines such as dogpile.com and webcrawler.com which believe it or not, people still use.
Blucora also owns TaxACT. It is a wonderful business. It is a fast growing online tax preparation firm. To understand how wonderful this business is, we have to understand the industry.
The tax preparation industry is dominated by Paid Preparers and the DIY people. Paid Preparers are tax stores such as H&R Block while DIY people are people who fill taxes using paper and pen and online. The market share of each is more or less split, although Paid Preparers is probably the front runner. For now.
Within the DIY segment, more and more people are shifting to online from paper and pen, AND, Paid Preparers are losing market share to the DIY segment. Although, the Paid Preparers will probably have a strong competitive edge due to complexity, but regardless, TaxACT is at the right segment of the industry. In addition, TaxACT has a wonderful business model which creates stickiness. When you are able to create stickiness at an early part of a growth phase and is able to generate high cash margins on that stickiness, you get very interesting results.
E-Commerce
Blucora also own Monoprice, an online retailer that sells consumer electronics under its label. I dont have much of a thought on this segment but it seems to be generating significant free cash flow so that is good.
Valuation
So, currently H&R Block, a paid preparer, trades at 8.2x EBITDA and had low single digits revenue growth. On the other hand, TaxACT had near mid double digits revenue growth rate in 2013. In addition, TaxACT have a lower reinvestment requirement. So, what is the right multiple for such a business?
Well, lets just slap on a 8.2x EBITDA and see what we get. Using the 2013 values (I dont use the LTM due to effects of seasonality, but it is much more conservative anyway), Blucora Tax Preparation business is worth $285 million.
Catalyst
Due to the cash generative nature of this firm, I think that time will be its own catalyst in this case.
Friday 3 October 2014
GoPro Part 2
In my last post, I did a relative valuation comparing GoPro to its closest comparable, Nikon. The problem with that is I am comparing two very different company and attempting to use one to price the other.
For one, GoPro has very different margin levels. For another, while the camera industry have been shrinking over the years, it seems that GoPro has buck the trend and produced significant growth, albeit shrinking growth rate. No surprising considering the company had multiple triple digits year. Given the very different circumstances, using comparables' multiple become suspect. Having said this, I decided to embark on valuing the company using a DCF instead.
In order to value GoPro using a DCF, the following inputs are required:
a) Revenue Growth Rate
b) Terminal Growth Rate
c) EBIT Margins
d) Tax Rates
e) Reinvestment Requirements
f) Cost of Capital
Revenue Growth Rate
In order to estimate revenue growth rate, I believe it is appropriate to compare it against the company's competitors.
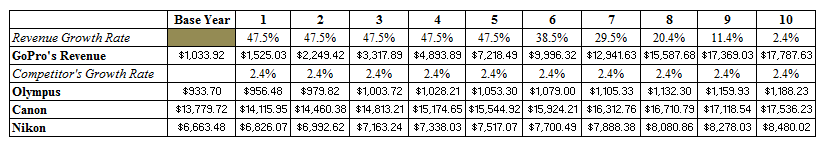
 From the picture above, one can see that GoPro owns only a small size of the camera market. This doesn't necessary have to be a bad thing. It represents market share that GoPro could potentially grab. Of course, GoPro products are niches as compared to its competitors which provide a wider range, but lets just assume GoPro is able to grow its revenue to be more inline with competitors. Why not right?
Assuming GoPro is able to grow its revenue to that inline of Canon, the market leader, the implicit returns is as follow:


For one, GoPro has very different margin levels. For another, while the camera industry have been shrinking over the years, it seems that GoPro has buck the trend and produced significant growth, albeit shrinking growth rate. No surprising considering the company had multiple triple digits year. Given the very different circumstances, using comparables' multiple become suspect. Having said this, I decided to embark on valuing the company using a DCF instead.
In order to value GoPro using a DCF, the following inputs are required:
a) Revenue Growth Rate
b) Terminal Growth Rate
c) EBIT Margins
d) Tax Rates
e) Reinvestment Requirements
f) Cost of Capital
Revenue Growth Rate
In order to estimate revenue growth rate, I believe it is appropriate to compare it against the company's competitors.
Assuming GoPro is able to grow its revenue to that inline of Canon, the market leader, the implicit returns is as follow:
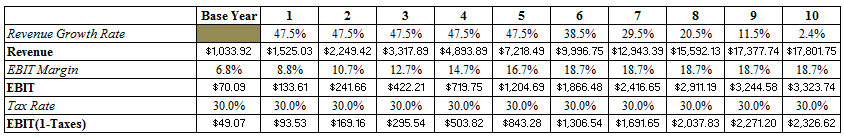
Terminal Growth Rate
As you can see from the picture above, the terminal growth rate is 2.4%, or more specifically, 2.44%. This is the US 10 year bond rate. I expect the industry to grow inline with the economy.
EBIT margin
Since I am looking for the bull case scenario to formulate a margin of safety on shorting GoPro, I have decided to use the highest EBIT margin that GoPro, Olumpus, Canon and Nikon have made over the last 6 years. The highest EBIT margin of 18.7% came from Canon back in 2011. This assumes that GoPro will more than double its existing margin. Well, why not?
Tax Rate
As for Tax Rate, I use a tax rate of 30%. Doesn't really make sense considering that the company operates in US, which have a 40% corporate tax rate, and had a 41% tax rate in the LTM. Again, why not?
Reinvestment Requirement
Currently, the average reinvestment requirement over the last 4 years of GoPro is 33.5%. Rather than using a 33.5% reinvestment requirement, I use a 25% reinvestment requirement. The lower the reinvestment requirement, the more aggressive the valuation.
Cost of Capital
Rather than using a growing company cost of capital, I use a lower, more aggressive 8.0% mature company cost of capital.
With all this factor in play, the intrinsic value of the company comes up to be $158.28 per share. or a 85.2% upside from current prices. Of course, my assumption takes into account of extremely aggressive, near the point of hilarity, assumptions.
Using a more conservative, albeit still aggressive assumption, value per share drops from the stratosphere. Just by using a 30% initial growth rate, a 15% EBIT margin, a 40% tax rate and a 30% reinvestment rate, value per share drops to $40.85 per share, or a 52% downside to current prices.
In my opinion, shorting GoPro at $85.46/share represents an attractive opportunity.
Thursday 2 October 2014
GoPro
GoPro is a company that develops, manufactures and markets action videos cameras. It is the industry leader of this market.
On June 25 2014, GoPro went IPO at $24/share. As of October 1 2014, GoPro trades at $91.80/share. At $91.80/share, I believe that GoPro is extremely overvalued. For a company that operates in a a highly competitive industry with deep pocketed competitors and slowing growth, a valuation multiple of 10x LTM P/S and >100x LTM EV/EBITDA is far too excessive.
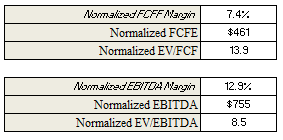
In this analysis, I will be using relative valuation to GoPro's competitors. GoPro's closest competitors are Nikon, Canon and Olympus, with Nikon being the closest comparable. The data shown in the following table comes from the the respective companies camera segment.


On June 25 2014, GoPro went IPO at $24/share. As of October 1 2014, GoPro trades at $91.80/share. At $91.80/share, I believe that GoPro is extremely overvalued. For a company that operates in a a highly competitive industry with deep pocketed competitors and slowing growth, a valuation multiple of 10x LTM P/S and >100x LTM EV/EBITDA is far too excessive.
In this analysis, I will be using relative valuation to GoPro's competitors. GoPro's closest competitors are Nikon, Canon and Olympus, with Nikon being the closest comparable. The data shown in the following table comes from the the respective companies camera segment.
While GoPro has robust revenue growth, unlike its competitors, one can see that revenue growth has been slowing down dramatically. In addition, from the data, it does not seem that GoPro has any exceptional margins on its products. In fact, relative to comparables, GoPro has one of the weakest margins in the industry. This make sense to me as the demographics that GoPro appeals to does not seem to have high purchasing power.
On a positive note, the company has lower CAPEX margins than comparables. In order to adjust for this, I believe an (EBITDA - CAPEX) margin would be more appropriate.
However, even with the adjustments, GoPro still has one of the weakest margins in the industry.
If one is to be given a scenario where you have a company that has half the EBITDA-CAPEX of its closest comparable, and has a slowing growth rate, albeit not to the point of negative growth rate as it is with the comparable but likely a convergence , I would expect the company to have similar multiples.
Nope.
GoPro trades at 18x Nikon, its closest comparable, EV/EBIT and 25x Nikon EV/EBITDA. In my opinion, such a valuation is beyond absurd and shorting this company should provide significant alpha.
Even if one adjusts EBIT and EBITDA for higher margins. The company still remains wildly overvalued.
Using the highest EBIT and EBITDA margin of GoPro and all of its competitors in the last 6 years, the MAX EV/EBIT and MAX EV/EBITDA goes to 60.3x and 56.0x respectively. What a valuation.
So what is the right price?
With the bull case valuation of $13.27 and a base case valuation of $4.42 on a EBIT basis, I believe that GoPro is an attractive risk/reward situation.
Saturday 27 September 2014
Centurion Revisted
In my previous two posts, I spoke about the fact that Centurion is earning below it's cost of capital and has poor capital allocation abilities.


However, one thing that I admit to having missed out is the fact that the company's current earnings potential to the asset base does not fully represent the normalized returns. This is because a huge chuck of value in the asset base is dormitories that are not yet operational, thus current return on capital does not fully represent reality. In addition, I have failed to net out taxes from the cost of debt calculation. This post is to rectify this problem.
In my opinion, when one attempts to go short a company, just as how one would identify a margin of safety for a long position, one should inverse and identify the best-case scenario and see if that gives one a margin of safety. This was what I did in my DCF calculations.
I believe that the growth rate that I employ is aggressive. While consensus estimates EBITDA margin to compress slightly towards 50%, I assume margin remains at current levels.
Next, I assume CAPEX % Revenue to be 45%. I believe this to be aggressive. This assumes that cost of lease per bed per month to be between $105 to $144 for the Singapore portfolio. This is at a 11% to 35% discount to a recent BCA tender of $161.50 per bed per month.
Following this, I would calculate the company's cost of capital with the post-UK acquisitions expected capital structure. Doing so, WACC comes up to 5.41%. Again, this is significantly below the aggressive and optimistic CIMB research report of 6.9%. To add on, I use a 2.5% terminal growth rate, instead of the 2.0% used by the CIMB analysts.
I believe this to be sufficiently aggressive.
Using these assumptions, I determine the aggressive, or bull case, intrinsic valuation comes up to be SG$0.62 per share. This represents a 17% downside, or should I say upside, to current prices.
I believe this that while the current is significantly below that of historical, shorting Centurion remains to be an attractive proposition.
Sunday 21 September 2014
YAHOO: Sum of the parts
In 2010, the investment thesis that David Einhorn of Greenlight Capital had on Vodafone was as straightforward as it was strange. He argues that the market is ignoring the fact that Vodafone owns 45% of Verizon Wireless. While such an opportunity could be expected from small companies without institutional following, Vodafone is a massive entity.
The very same situation is occurring right now with Yahoo.
As you know, Yahoo is a technology search engine company with $4.6 billion in revenue in the LTM. At the current $42 billion market capitalization, this represents a 9.2x Price to Sales ratio. This is an exceedingly high ratio for a company that has mid teens digit EBIT margins and is losing revenue for the last 6 years.
The reason is because investors aren't valuing Yahoo solely on its operating assets, but also the assets that Yahoo owns.
Yahoo owns 35% of Yahoo Japan, an entity separate from Yahoo that operates in Japan. In addition, it owns 401.8 million shares of post-ipo Alibaba.

At current market capitalization, the market is implying that Yahoo Core is worth NEGATIVE $3.6 billion.
In my opinion this is ludicrous and represents an attractive opportunity.


The very same situation is occurring right now with Yahoo.
As you know, Yahoo is a technology search engine company with $4.6 billion in revenue in the LTM. At the current $42 billion market capitalization, this represents a 9.2x Price to Sales ratio. This is an exceedingly high ratio for a company that has mid teens digit EBIT margins and is losing revenue for the last 6 years.
The reason is because investors aren't valuing Yahoo solely on its operating assets, but also the assets that Yahoo owns.
Yahoo owns 35% of Yahoo Japan, an entity separate from Yahoo that operates in Japan. In addition, it owns 401.8 million shares of post-ipo Alibaba.
In my opinion this is ludicrous and represents an attractive opportunity.
With the sale of 127.1 million shares of BABA and Yahoo current balance sheet makeup, Yahoo Core Est. EV is NEGATIVE $12.47 billion. For a company that made $337M in EBIT in the LTM, this represents an amazing opportunity.
So, how can one take advantage of this discrepancy?
An illustration:
For every 1000 shares of Yahoo purchased, one should sell short 1932 shares of Yahoo Japan and 389 shares of Alibaba. By doing this, one can isolate Yahoo's core operating business.
What is the right price?
It is hard to say considering that Yahoo Core is in the midst of attempting a turnaround. However, I believe that ascribing a 0.3x EV/Revenue would be more than conservative. This would imply that Yahoo is trading at ~4x EBIT.
At $54.36, buying Yahoo now represents a 33% upside. HOWEVER, if one executes the hedge and isolates Yahoo Core business, one can theoretically obtain an infinite IRR. Why so? Because at current valuation, the market is ascribing Yahoo Core at less than 0.
Friday 12 September 2014
Giordano: Risk Reward
Giordano is leading casualwear retailer in Asia with over 1369 self-operated stores, 842 franchised stores and 449 affiliated stores in 2013. It mainly operates in Greater China, Southeast Asia, Japan and Australia.
It currently trades at HK$4.58, or a normalized 13.9x EV/FCF or a 8.5x EV/EBITDA. I believe that Giordano is likely undervalued with tremendous upside.
 While I do not have much of an unique insight in the apparel industry, I believe that the risk reward makeup on Giordano is more than enough to make up for this deficiency.
Giordano is a company which has tremendous cash generating capabilities. This is reflected in it having a normalized ROIC of 96.0%. This is possible because the company has a large, albeit cyclical, franchise base. This also explains why the company would choose to return capital back to shareholders via dividends instead of reinvesting it.
 However, due to a challenging outlook in 2014 and the reality being as such. Giordano suffered a 49% decline in earnings in 1H14. The result? A faltering share price. But, as the adage goes,
"Be fearful when others are greedy, and greedy when others are fearful", I believe this is the time to be greedy.
At HK$4.58, the market implies that Giordano would have a steady state growth rate of -0.68%. While this is possible, I do not find it probable, considering its geographical location and product offering. In addition, the company has a 6.2% CAGR for the last 9 years and the market does not seem to have a good reason to explain such a large discrepancy.

Even if I am wrong, from my DCF sensitivity chart above, you can see that the downside from getting the terminal growth rate wrong is much lower than getting it right. I believe that probability would be skewed towards the upper end of the growth rate because Giodarno operates in regions with mid-single digits inflation rate.
At HK$4.58 and a terminal growth rate of 2.5%, this represent a 106% upside. In the meantime, you will own an undervalued company that pays a 7.5% dividend. In a yield-starved environment, this represents an excellent opportunity.
It currently trades at HK$4.58, or a normalized 13.9x EV/FCF or a 8.5x EV/EBITDA. I believe that Giordano is likely undervalued with tremendous upside.
Giordano is a company which has tremendous cash generating capabilities. This is reflected in it having a normalized ROIC of 96.0%. This is possible because the company has a large, albeit cyclical, franchise base. This also explains why the company would choose to return capital back to shareholders via dividends instead of reinvesting it.
"Be fearful when others are greedy, and greedy when others are fearful", I believe this is the time to be greedy.
At HK$4.58, the market implies that Giordano would have a steady state growth rate of -0.68%. While this is possible, I do not find it probable, considering its geographical location and product offering. In addition, the company has a 6.2% CAGR for the last 9 years and the market does not seem to have a good reason to explain such a large discrepancy.
At HK$4.58 and a terminal growth rate of 2.5%, this represent a 106% upside. In the meantime, you will own an undervalued company that pays a 7.5% dividend. In a yield-starved environment, this represents an excellent opportunity.
Friday 5 September 2014
Centurion Corporation: Completion of Acquisitions of UK Student Accommodation
On the 2nd of September, Centurion has finally completed the acquisition of four student accommodation asset for the total price of £77 million (S$157 million). This is significant as this represents an increase of 37% of the company's long term assets. It may then strange that I did not mention this is my prior post. This is with good reason.
With a S$68 million cash balance, Centurion must finance the acquisition with debt. The announcement of the acquisition stated that the company would tap into its S$300 million 5.25% Multicurrency MTN program and borrow S$100 million.
When you are short a company which is planning to make extremely poor capital allocation decisions and at the same time signals weakness is its existing business, you keep quiet and let it do it.
The acquisition of the four UK student accommodation is significant in many ways:
1) Leverage.
With a S$68 million cash balance, Centurion must finance the acquisition with debt. The announcement of the acquisition stated that the company would tap into its S$300 million 5.25% Multicurrency MTN program and borrow S$100 million.
Using a listed UK student's accommodation company, Unite Group, as a proxy to determine EBITDA/Assets margin, Centurion should generate an additional S$10.5 million in EBITDA. I believe this estimate is aggressive as this assumes that Centurion has not overpaid on its acquisition and that they are as efficient run as Unite-Group.
From this, Net Debt/EBITDA would rise from 7.2x to 9.2x, Interest Bearing Debt/EBITDA would rise from 2.7x to 4.5x, and EBIT/Interest Expenses would drop from 4.4x to 3.0x. This adds tremendous pressure to the company.
For a company that is trading at an adjusted net income of 47x, every incremental risk unit adds an increasing amount of pressure on valuation.
2) Inability to renew Westlite Tuas
Centurion's Westlite Tuas lease is soon to expire in 2017. Using a recent BCA tender as a proxy, expected cost of renewal of a 9 year lease would be S$150 million*.
*This assumes a cost of $161.5/bed/month.
With Centurion's current financial situation as stated out in 1), Centurion likely would not be able to finance their Tuas dormitories, UNLESS, the company puts the financial health of the current company in jeopardy (Another S$100 million would bring Interest Bearing Debt/EBITDA to 8.4x from 4.5x) or the company issue equity (which would be dilutive to existing shareholders).
Given the situation, Centurion would most likely lose a significant portion of its earnings when the lease runs out. This is what I believe to be the most likely scenario. Given that the majority portion of Centurion's earnings is derived from their Singapore portfolio, and the Westlite Tuas dormitory is estimated to be over 35% of the Singapore portfolio returns, I expect the damage to be material. Putting further pressure on valuation multiples.
However, on a positive note, I was informed that my adjusted net income and EBIT is inaccurate in my previous post as I did not normalize net income for upcoming projects such as the Westlite Woodlands project. However, the effect of such would not offset much of the damage caused by the Westlite Tuas expiry.
3) Decision to acquire
It seems strange to me that the company's management would divert their attention from their apparently highly profitable and growing Singapore workers' dormitories business to the UK student accommodation market, which is mature and competitive. This is likely due to a couple of reasons: A) The company is an operator of workers' dormitories, not a construction company. They are restricted by the number of workers' dormitories available for acquisition in Singapore and it seems that they have ran out of options. B) The prospects of the workers' dormitories market is likely not as attractive as once sought out to be. The market has virtually no barriers of entry, and has high replacement cost. A combination of the two would result in margin compression and low EBIT margin.
As a result, growth rate embed in valuation seems ever more detached from reality.
4) A sign of euphoria
Unite-group, which uses the same, if not more conservative, accounting method as Centurion trades a ~1.0x book value. This makes sense as Unite-group basically did the valuation work for investors.
However, when the acquisition was proposed by company's management, stock price rose from 47.5c or 1.37x book value then to a high of 76.0c or a ~1.8x book value. This seems illogical as 1) Centurion has the same, if not more aggressive, accounting policy as Unite and 2) If a significant portion of your assets is going to have a comparable which is trading at 1.0x book value, it doesn't make sense to me for multiple expansion. I believe this is a sign of euphoria.
All in all, I believe this company is a good short with a bull case of 42c per share. However, as the company is actually destroying value in growth as said in my previous post, and has a balance sheet with growing leverage, I believe the bear case is much more compelling.
British Petroleum - BP
There are generally 3 types of situation which creates great value propositions: Unknown, Unloved. Special Situations. In the case of British Petroleum, it is unloved.
http://www.forbes.com/sites/robertwood/2014/09/05/bp-grossly-negligent-in-gulf-spill-eyes-18-billion-penalty-and-tax-deduction/
While the work was not mine, David Einhorn of Greenlight Capital estimated that the Net Asset Value (NAV) of BP was $70 per share, after allowing for a more negative legal outcome. Although the actual legal outcome was probably far more severe than expected, I believe that value still exists.
BP has also been selling down non-core, unproductive downstream assets which they hold so as to return capital to shareholders. This is value accretive for two reasons.
1) The company can create value by selling assets at or above NAV and buy back stocks at a discount to NAV.
2) The remaining company would be a more focus and higher ROC company.
Over the long time when the legal situation slowly subsides. I believe BP would at least trade at NAV, which using Einhorn's estimation, be at least $60 per share. $60 per share allows for a $30 billion in additional legal damage. I believe this is conservative.
At the current $46/share, this represents a 30% upside. In the meantime, you will be holding an industry leader that trades at 12x earnings with a 5% dividend yield.
JAPFA Ltd Stock Pitch
Link to Stock Pitch: https://www.dropbox.com/s/o32mut4oo36087e/JAPFA%20LTD%20STOCK%20PITCH.pdf?dl=0
Link to Financial Model: https://www.dropbox.com/s/y7dyb0x5owhmv5x/JAPFA%20FINANCIAL%20MODEL.xlsx?dl=0
Link to Financial Model: https://www.dropbox.com/s/y7dyb0x5owhmv5x/JAPFA%20FINANCIAL%20MODEL.xlsx?dl=0
Tuesday 2 September 2014
The Risk of Financial Modeling
In my previous post, I spoke about Japfa Ltd and my belief that the company would not be able to keep up with industry growth rate. In addition, I believe that the industry might undergo fragmentation which would compress margins.
In this post, I would like to retract some of my thoughts on Japfa Ltd. For one, I realized that I have made a mistake in my model which blew maintenance CAPEX out. I erroneously used inflation rather than D&A with inflation as a proxy. When adjusted, the risk of Japfa drops tremendously.
For example, (EBITDA-Maintenance CAPEX)/Interest Expenses is now at a healthy 1.5x, and ROIC is in the low-mid teens range. This is critical as this means that the company has the ability to generate value by adding debt to the business, and they are more than able to do that with a 1.5x (EBITDA-Maintenance CAPEX)/ Interest Expenses. Concurrently, even with expansionary CAPEX (Includes growth required to maintain market share), the ratio remains above 1.0x.
This has tremendous implications. For one, it means that the company is no longer destroying value in growth. For another, it means that industry fragmentation (while still a risk) is less likely to occur. It is even possible for Japfa to do expansionary+ (growing market share) CAPEX.
A complete 180 degree turn from a single mistake. This is the risk of using a financial model, a single mistake could wreck your model. The morale of the story: Double check your work (especially if you are posting it online for the world to see).
Monday 1 September 2014
JAPFA Ltd: Analysis & Risk
Link to Japfa Ltd financial model: https://www.dropbox.com/s/y7dyb0x5owhmv5x/JAPFA%20FINANCIAL%20MODEL.xlsx?dl=0
The problem with capital-intensive company with high margins is that is is hard to sustain that margins. This is because if whatever is driving high margins is a result of capital expenditures, existing industry players or new entrance could easily lever up and drive down margins. Japfa Ltd has this risk.
The problem with capital-intensive company with high margins is that is is hard to sustain that margins. This is because if whatever is driving high margins is a result of capital expenditures, existing industry players or new entrance could easily lever up and drive down margins. Japfa Ltd has this risk.
Japfa Ltd is an agri-food company that produces multiple protein food (poultry, milk, etc) in five emerging Asian markets, most notably, Indonesia.
In the Indonesian segment, the poultry industry is highly concentrated, with the top 2 players owning over 50% of the DOCs and Animal Feed markets. This market concentration has led to Japfa Ltd to have a significant margin on their revenue in comparison to its western comparables such as Tyson Foods. Tyson Foods operates primarily in the United States, where the protein industry is fragmented, and thus has lower margins. For example, Japfa Ltd has a 9.5% EBITDA margins, while Tyson has a 5.8% EBITDA margin. This is a massive premium.
At the same time, operating in emerging markets means that expected growth rate is significant. When you have a capital intensive company that operates in a high growth environment, capital is crucial as capital expenditure will be high. The Indonesia poultry market is expected to grow in the mid-high teens for at least the next 5 years, and the China dairy market (which Japfa Ltd also operates in) with similar, if not higher growth rate. This is massive growth.
So now the real question is this. Can Japfa Ltd meet the expected growth rate in the industry in which it operates in?
I believe the answer is no.
Japfa Ltd already has a (EBITDA - Maintenance CAPEX)/ Net Interest Expense ratio below 1, maintenance CAPEX being an adjusted inflation rate by geographical segment, let alone expansionary CAPEX. What this means is that the company is unable to service its interest expenses after spending cash on CAPEX. As a result, maintenance CAPEX cannot be fulfilled, UNLESS, the company is able to fund its CAPEX requirements from external sources, such as through an equity and debt offering. This was what they did. The problem with doing an equity offering is that it dilutes value if the stock price is undervalued.
By the way, what I mean by maintenance CAPEX is the cost required to keep current production going. Expansionary CAPEX, on the other hand, is the cost required to maintain market share.
So the alternative is a debt offering. A debt offering would be accretive to value, so long as the return on incremental capital is above the cost of debt. With a headline ROIC and a cost of debt of 16% and 6.8% respectively, this seems to be the way to go. However, if this is indeed true, the company should not have done an equity offering as that would be dilutive. There must be a reason.
I think the reason is two-folds.
1) Headline ROIC and cost of debt is erroneous. I believe true ROIC is below the current 16% as a result of a highly inflationary environment. Such an environment would result in future replacement cost (maintenance CAPEX) to be higher than historical cost. If one uses maintenance CAPEX in lieu of D&A, ROIC would drop below cost of debt. In addition, cost of debt might be depressed as total debt includes ~$400 million of revolving credit, which interest may not be reflected on the income statement. Since a debt offering would in fact be damaging to results, an equity offering is the alternative.
2) Listing in the SGX allows the company to gain access to a more liquid financial market. This allows the company to refinance at lower rates. However, this would not be helpful as the return on incremental capital will likely still be below the adjusted cost of debt. I believe this is true because in 2013, Japfa Comfeed, a subsidiary to Japfa Ltd, issued $225m of SECURED SENIOR debt of 6%. This is above the adjusted ROIC of sub 4.0%.
Back to answering the question, if the company is unable to produce returns above the cost of debt, this means that the company should not raise debt to finance its maintenance CAPEX, as that would ultimately be value destructive. Thus, the company would not be able to keep ongoing operations running, lest they raise capital through further equity offering (which is dilutive), let alone keep up with the industry expected growth rate.
However, growth rate has to flow somewhere and I believe it would follow to industry players that are not as levered as Japfa Ltd. An example would be Malindo, which has a Debt/EBITDA of 1.7x and a (EBITDA - Maintenance CAPEX)/Interest Expenses of 4.8x, as compared to Japfa Ltd, which has a Debt/EBITDA of 3.8x and a (EBITDA - Maintenance CAPEX)/Interest Expenses of <1x.
What this implies is that the industry is likely to undergo fragmentation and this would depress EBITDA Margin, which would further accelerate fragmentation. With a 9.5% EBITDA margin compared to Tyson Foods' EBITDA margin of 5.8%, margin compression has a long way to fall.
Margin compression, massive debt burden and elevated valuation multiple...this could be a recipe for disaster.
Saturday 30 August 2014
Centurion Corporation
Centurion is the largest listed worker dormitories company in Singapore. Prior to a reverse takeover, Centurion was known as SM Summit, a manufacturer of optical disks. After the RTO, the company was renamed centurion, with a core business in workers dormitories.
The company trades at a 50x adjusted P/E ratio and 1.5x book value.

There is a good reason why the company is trading at such rich valuations. Singapore is a country which heavily relies on foreign workers, especially in the construction, oil & gas and manufacturing industries. There are over 1 million foreign workers (excl. domestic workers) in Singapore, but only 41 commercially run workers' dormitories, which holds between 1,500 to 12,000 beds per dormitory. Given the circumstances, workers dormitories companies would benefit as rental rates and occupancy levels remain high. However, in spite of these favorable macroeconomic factors, I believe that Centurion remains grossly overvalued.
Centurion operates in an industry which is commoditized and capital intensive. Such industries tend to have very low margins and return on incremental capital. This is reflected in the financial ratios which shows that the company is trading at 35x EV/EBIT and a 3.24% ROC.
Considering such slim margins, it is hard to imagine how it is possible that the company can grow into its valuations.
In fact, growing into its valuation seems to be an impossibility. The company has a 5.25% cost of senior secured debt, which is above the company's return on capital. If you have a company which is capital intensive, and has a ROC which is below even the lowest cost of debt, and is already heavily levered with a Debt/EBITDA of 9.5x, it is highly unlikely that it will grow into its 50x PE ratio.
In addition, the company's accounting policies on investment properties uses a L3 mark-to-model method. This basically means that the company did a discounted cash flow on its investment properties and marked that as the value of the investment properties. The problem with this is that it is possible that the company had used too aggressive an assumption in its valuation. However, since data is not fully transparent, I would give the benefit of the doubt to Centurion and assume valuation is accurate.
However, if valuation is accurate, what that basically means is that the company did the valuation work for us, and one should at most, pay 1.0x book value for a company that actually destroy value in growth.
The closest comparable to Centurion Corporation would be the LSE listed Unite-group. Unite-group operates students dormitories in the UK and trades a ~1.1x book value, with a much lower cost of capital and higher return on incremental capital. On the other hand, Centurion is trading at a ~1.5x book value. This does not make sense to me.
In conclusion, I do not think Centurion's valuation is reasonable. At best, the company is worth 1.0x book value, or $0.42 per share, or a 33% downside to current prices . At worst, the company is destroying value in growth, and the company should be valued at a significant discount to book.
The company trades at a 50x adjusted P/E ratio and 1.5x book value.
There is a good reason why the company is trading at such rich valuations. Singapore is a country which heavily relies on foreign workers, especially in the construction, oil & gas and manufacturing industries. There are over 1 million foreign workers (excl. domestic workers) in Singapore, but only 41 commercially run workers' dormitories, which holds between 1,500 to 12,000 beds per dormitory. Given the circumstances, workers dormitories companies would benefit as rental rates and occupancy levels remain high. However, in spite of these favorable macroeconomic factors, I believe that Centurion remains grossly overvalued.
Centurion operates in an industry which is commoditized and capital intensive. Such industries tend to have very low margins and return on incremental capital. This is reflected in the financial ratios which shows that the company is trading at 35x EV/EBIT and a 3.24% ROC.
Considering such slim margins, it is hard to imagine how it is possible that the company can grow into its valuations.
In fact, growing into its valuation seems to be an impossibility. The company has a 5.25% cost of senior secured debt, which is above the company's return on capital. If you have a company which is capital intensive, and has a ROC which is below even the lowest cost of debt, and is already heavily levered with a Debt/EBITDA of 9.5x, it is highly unlikely that it will grow into its 50x PE ratio.
In addition, the company's accounting policies on investment properties uses a L3 mark-to-model method. This basically means that the company did a discounted cash flow on its investment properties and marked that as the value of the investment properties. The problem with this is that it is possible that the company had used too aggressive an assumption in its valuation. However, since data is not fully transparent, I would give the benefit of the doubt to Centurion and assume valuation is accurate.
However, if valuation is accurate, what that basically means is that the company did the valuation work for us, and one should at most, pay 1.0x book value for a company that actually destroy value in growth.
The closest comparable to Centurion Corporation would be the LSE listed Unite-group. Unite-group operates students dormitories in the UK and trades a ~1.1x book value, with a much lower cost of capital and higher return on incremental capital. On the other hand, Centurion is trading at a ~1.5x book value. This does not make sense to me.
In conclusion, I do not think Centurion's valuation is reasonable. At best, the company is worth 1.0x book value, or $0.42 per share, or a 33% downside to current prices . At worst, the company is destroying value in growth, and the company should be valued at a significant discount to book.
HupSteel Inc
Link to thesis: https://www.dropbox.com/s/ximoek5xfry6rk0/HupSteel.pdf?dl=0
Link to spreadsheet:
https://www.dropbox.com/s/b1fdyxv39pitzzm/HupSteel%20Financial%20Model.xlsx?dl=0
The thesis is 6-months dated. I would give an updated version once the company releases its annual reports.
Summarized version
Business Description
Hupsteel is a supplier and stockist of industrial hardware infrastructure.
It mainly sells pipes & fittings and structural steel to the Marine, Oil & Gas and construction industry in Singapore.
The company also owns 130,000 square feet of freehold investment properties in which it rents out.
Highlights
$0.25 in working capital (current assets - total liabilities)
Current assets consist of assets with high recovery value such as cash and available-for-sale financial assets and semi-high recovery value such as inventories. The only risk is in accounts receivables which has a spiking +180DPD receivables value.
The stockist business model allows the company to remain profitable even in lights of economic distress.
The company is near or has already passed its cyclical trough.
The company also owns significant investment properties holdings. I estimate the value of these holdings to be roughly $0.185.
I believe that the company has invested too heavily into CAPEX historically, which led to excess capacity. At best, these excess capacity provides no value. At worst, they are a drag to results. The company could easily monetize this asset which would be instantly accretive to the company's value.
By buying this company today at $0.21, you are buying a company that is trading below Graham's net-net valuation ($0.25), and you get the investment properties, excess capacity, and business for free.
Valuation
In the base case, the company has a 140% upside of non-activism value.
In the bear case, the company still possess a 50% upside to current price.
In the bull case, the company has a 165% upside of non-activism value.
Subscribe to:
Posts (Atom)